The art of investing often comes down to the science of security selection and weighting. Discretionary and systematic asset managers alike seek out excess returns through strategies that operationalize their investment philosophies with positions chosen and sized accordingly. All other things being equal, such investors normally prefer to be long names with positive underlying sentiment than the alternative. In that stead, Amenity’s NLP solutions oÔ¨Äer a diÔ¨Äerentiated approach for investors to measure and manage qualitative dimensions of the investment process. This empowers investors with new metrics to gauge exposure to untapped idiosyncrasies that can serve as additional factors in the investing process.
In this note, we pilot a method of analyzing earnings call transcripts for multiple companies to evaluate the impact of discussions by management and analysts on portfolios with diverse, unevenly distributed holdings. We aggregate company speciÔ¨Åc Amenity Scoresby accounting for position size to construct an Amenity Portfolio Score. We apply the method to Berkshire Hathaway’s portfolio as a test case and detail the Oracle of Omaha’s scores on both the portfolio and holding level.
Spoiler Alert: Berkshire Hathaway’s Amenity Portfolio Score of 29.4 is higher than the average Amenity Scoreof 12 across all companies. This is a function of security selection (two-thirds of the holdings have positive Amenity Scores) and security weighting (the top ten positions by Amenity Score account for more than 50% of the portfolio) that favors investments in companies with positive Amenity Scores.
Thinking in the Aggregate
We frequently demonstrate the utility of Amenity’s NLP models by sharing our insights into the earnings calls of public companies. Analysts and investors tune into earnings calls because they are substantively focused on the health and prospects of a business. And yet, we know that objective and reliable metrics for evaluating such qualitative dimensions of the investment process are all too rare. In response to this absence, Amenity innovates a wide variety of NLP solutions that empower users with objective, material, and actionable insights into the contents of Ô¨Ånancial text such as earnings calls.
As part of our mission to transform text into valuable assets, Amenity generates data including Amenity Scores— statistical representations of the meaning and relevancy of underlying content in earnings calls. These scores range from -100 (most negative) to +100 (most positive) and indicate the implications of discussions about business fundamentals by management and analysts. Models we employ are designed and reÔ¨Åned to capture and interpret the fundamentals that matter most to analysts and investors. As the world and our clients evolve, so too do our models. And by focusing on achieving high levels of recall and precision, we are able to deliver measurable eÔ¨Écacy in solving real world problems.
Many insights we have shared compare company level Amenity Scores. At the same time, we recognize that analysts and investors often deal in baskets of holdings that are diversified and unevenly distributed. The drivers of investment rationales are many and varying levels of confidence and capital inevitably lead to investments that are sized accordingly. This creates uneven exposures to the underlying fundamentals of holdings in any portfolio. And as a result, apples-to-apples comparisons only solve part of the puzzle.
With that in mind, we pilot a framework for aggregating Amenity Scores in a manner that takes portfolio composition into account. Our motivation is to develop methods that are relevant to the day to day lives of our clients and empower users to drill up as easily as they can drill down when interpreting our data.
Methodological Approach
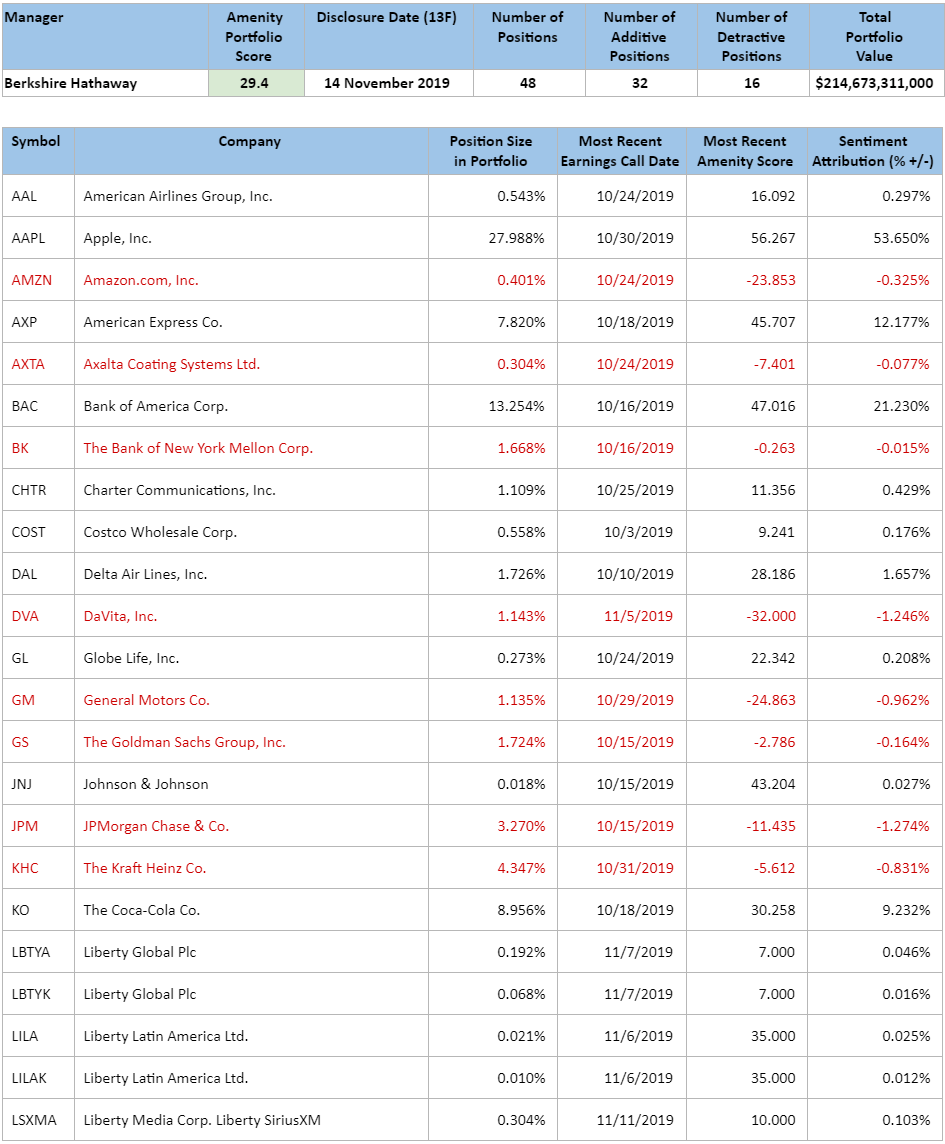
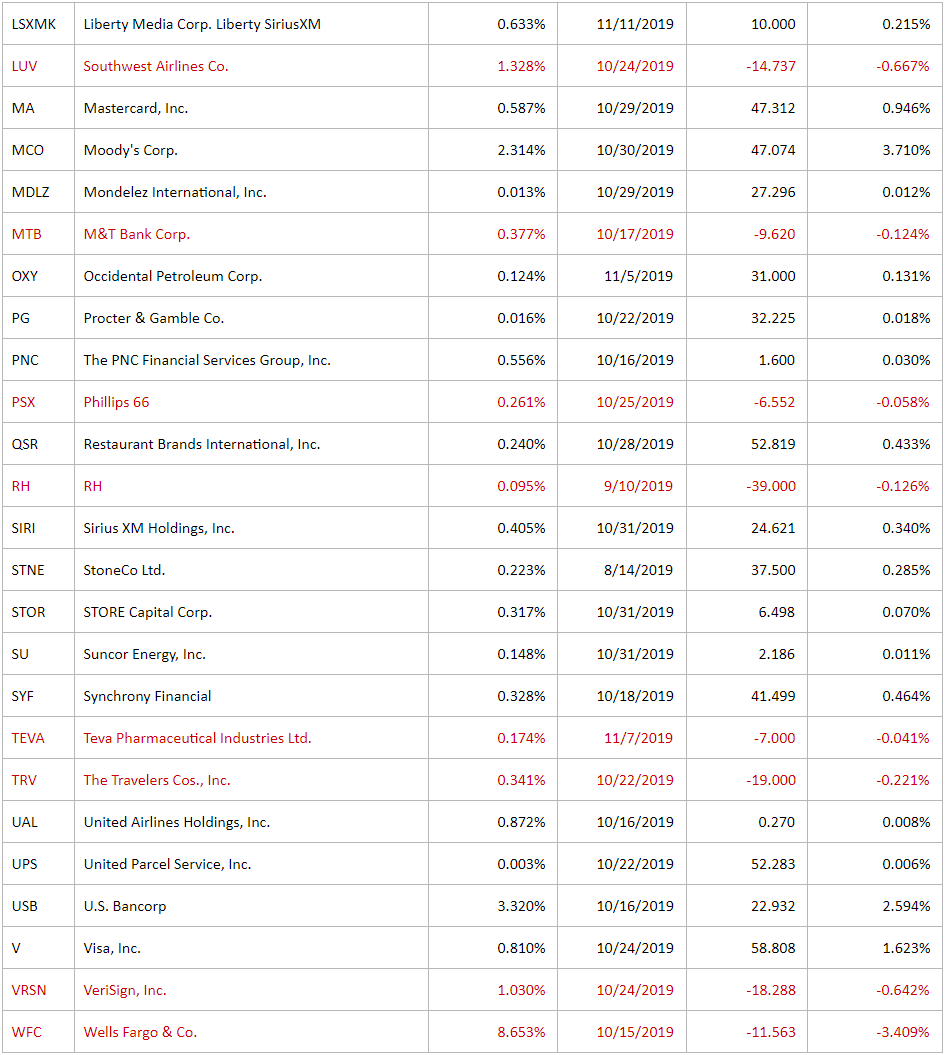
We calculate an Amenity Portfolio Scorefor a simulated basket of equities by incorporating a mix of Amenity Scores and Ô¨Ålings data. We use Berkshire Hathaway’s most recent 13F (14 November 2019) to generate a list of 48 holdings with their portfolio weights and match the most recent Amenity Score for each ticker. (If multiple share classes of one company are owned, we assign the same Amenity Score to both positions.) Amenity Scores are then multiplied by position size to calculate a position score that is proportional to its weight in the portfolio. Position scores are summed to create an Amenity Portfolio Score for the overall portfolio. We present results from this transformation in the Appendix.
Interpreting the Results
We Ô¨Ånd that the Oracle of Omaha’s portfolio at Berkshire Hathaway has an Amenity Portfolio Score of 29.4 on a scale from -100 (most negative) to +100 (most positive).
Berkshire Hathaway’s portfolio score compares favorably to the average company in our data universe, which totals more than 12,000 companies that have reported earnings since January 2009.Across that entire dataset,the average Amenity Score per company is 12, meaning BuÔ¨Äett’s portfolio is positioned signiÔ¨Åcantly more positively than the average individual company.
Warren BuÔ¨Äett, ToddCombs, and Ted Weschler are master practitioners of the craft and the positivity of Berkshire Hathaway’s portfolio score lines up with narratives of the investment team’s prowess as stock pickers. Rather than conÔ¨Årming what many already know, we believe our Amenity Portfolio Score further identiÔ¨Åes just how much security selection and weighting matter to portfolio managers.
Despite hordes of followers and an unrelenting focus on quality, the Berkshire Hathaway portfolio score is nowhere near the maximum of +100. In fact, one in three holdings (16 of 48) have negative Amenity Scores. However, these positions together account for only 26% of the portfolio’s market value, which limits their impact on the portfolio score accordingly. At the same time, 74% of the portfolio is invested in Ô¨Årms with positive Amenity Scores and the top ten holdings ranked by Amenity Score account for more than half of the portfolio’s total invested capital.
Analysis & Attribution
While partially a truism of portfolio management, the evidence suggests that the Berkshire Hathaway portfolio’s outperformance of the average company is driven by a tendency to (1) select securities with higher than average Amenity Scores and (2) weight holdings with higher Amenity Scores more heavily.
For example, the most recent addition to the Berkshire Hathaway portfolio is a stake in RH (RH), formerly Restoration Hardware. That company’s most recent Amenity Score was -39 (the lowest Amenity Score in the portfolio). Despite such marked negativity, the RH position creates a relatively insigniÔ¨Åcant -0.13% drag on the portfolio score as it amounts to an allocation of only 0.10% of invested capital.
Conversely, Apple Inc. (AAPL) is the largest holding in the portfolio at 28% of invested capital. Apple’s most recent Amenity Score was +56, which combined with its position size accounts for more than half of the portfolio score. The only holding with a higher Amenity Score than Apple is Visa (V) at +59, but its 1% position size provides a nominal tailwind of only +1.6% to the portfolio score.
Illustrative Rankings
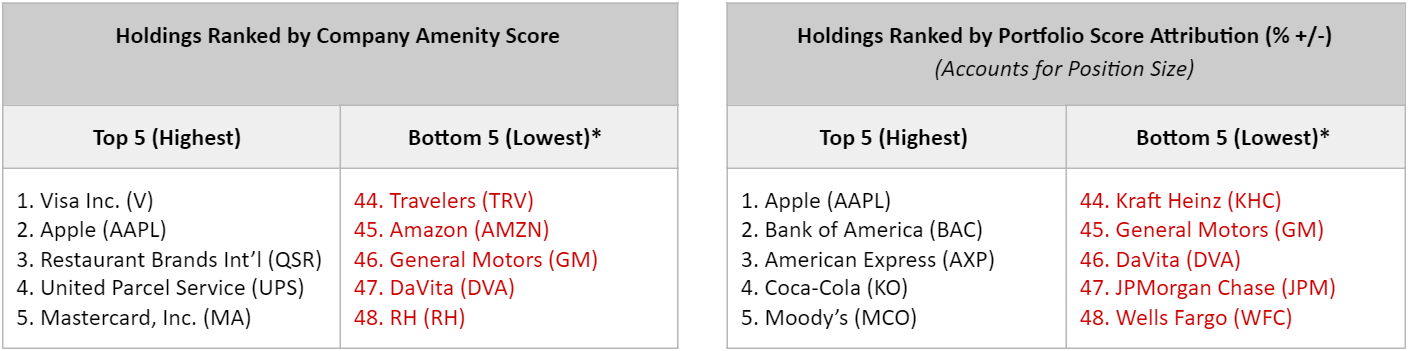
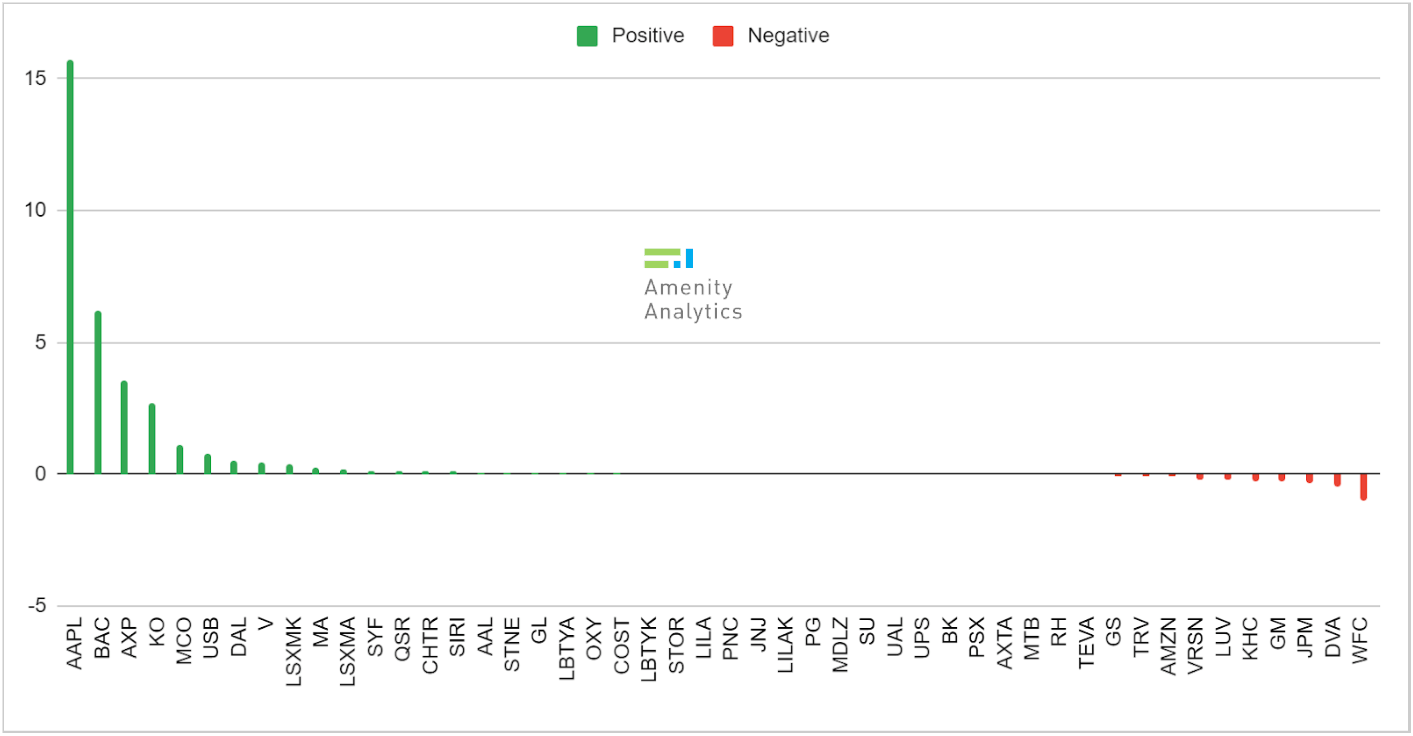
We oÔ¨Äer illustrative visualizations to contextualize Berkshire Hathaway’s portfolio from the perspective of Amenity Scores. Table 1 details the top and bottom Ô¨Åve holdings ranked by company Amenity Scores and attributions to the Amenity Portfolio Score. Figure 1 visualizes the portion of the portfolio score that is attributable to each position.Additional details can be found in the Appendix.
Table 1: Top 5/Bottom 5 Holdings by Amenity Score & Attribution to Portfolio Score
*Red indicates a negative Amenity Score detractive to the overall Amenity Portfolio Score.
Figure 1: Amenity Portfolio Score Attribution by Position
Why it Matters
For analysts and investors that follow Berkshire Hathaway’s investments, we oÔ¨Äer a particularly valuable approach given that the company does not host its own earnings calls. To the extent that holdings are an expression of the worldview of portfolio managers, Berkshire Hathaway’s Amenity Portfolio Score may be as close a proxy as we might expect for a Warren BuÔ¨Äett earnings call.
More broadly, we believe the technique presented here offers an elementary method of accounting for an important qualitative dimension of the investment process that has historically been hard to quantify.Assuming a preference for positively positioned portfolios, we hope that these sorts of metrics present deeper insights into portfolio exposures and new opportunities to set measurable targets to manage towards on a discretionary or systematic basis.
What’s Next?
Amenity aims to augment the expertise of our clients by using innovative technology to map investment philosophy to actionable insights. We believe the types of portfolio metrics discussed in this note may be useful factors in the process of security selection and weighting, not least because they focus on differentiated data with scalable methods. The multiplicity of models we maintain allows users to think through alternative lenses like Deceptionand ESG, which may open the door to profound new ways to think about and act upon idiosyncratic exposures when incorporated in portfolio analytics.
In the nearer term, we will continue experimenting with this type of analysis and offer regular insights into widely followed portfolios to gauge the skill of asset managers in constructing positively positioned portfolios and analyze how various positions and strategies impact Amenity Portfolio Scores.
If there is a portfolio you follow that you would like us to analyze,or if you would be interested in us scoring your holdings, please reach out at any time. As always, we welcome feedback and comments from our readers and look forward to reaching out again soon.
APPENDIX: Amenity Portfolio Analytics — Berkshire Hathaway, 14 November 2019
Interested running these types of analyses with our platform?
Request a demo today to find out how you can analyze earnings call transcripts and other financial documents with our text analytics platform. Spot outliers, identify critical insights, and understand key drivers.
About Amenity
Amenity Analytics is the industry leader in providing insights from unstructured text by using Natural Language Processing (NLP) assisted by Artificial Intelligence (AI) and Machine Learning (ML). Amenity’s NLP system is a sector-agnostic, language-dependent tool for quantitative text analysis that is deployed across the financial services industry and beyond.
This communication does not represent investment advice. Transcript text provided by FACTSET and S&P Global Market Intelligence.
Slowing global growth and an inverted yield curve have begun to rattle markets and stoke investor fears:
Does the outlook of US public companies support those fears?
Is there actual evidence of the US inheriting weakness from abroad?
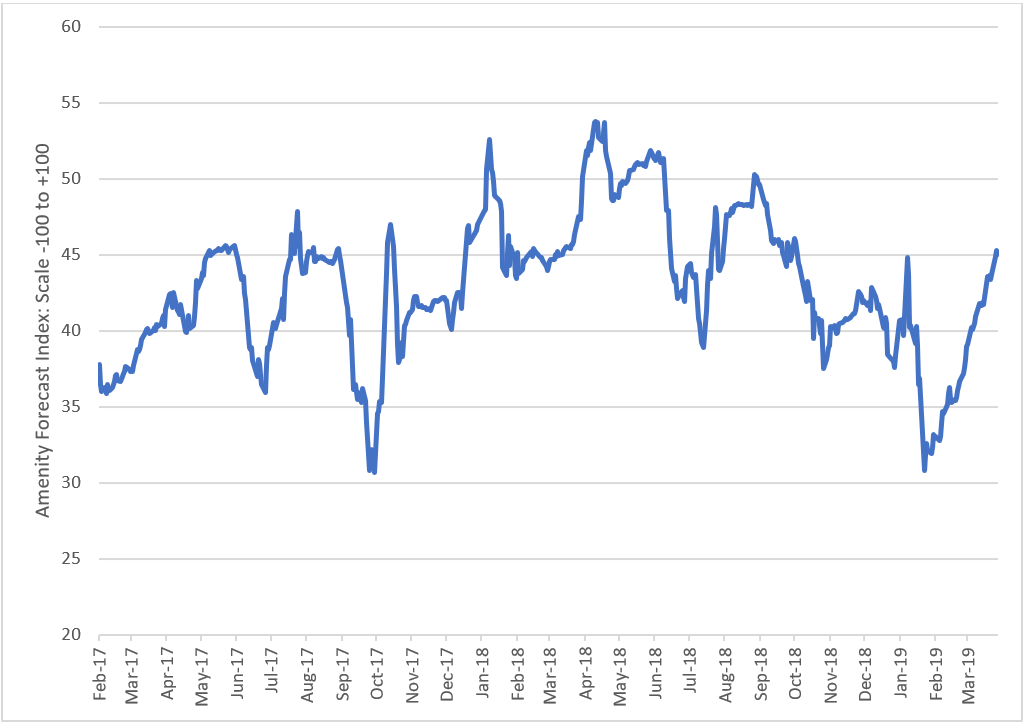
To address these questions with data and facts, we look to the Amenity Forecast Index, which quantifies the tone of forward-looking commentary of US public companies. What did we find? The Amenity Forecast Index checks in at 45.0, sharply off the lows, but down 5% year-over-year. The recent bounce suggests companies are more optimistic when looking past a softer Q1.
About the Index: Earnings sentiment of only forward-looking commentary from U.S. quarterly earnings calls. This analysis goes beyond the stated revenue and EPS guidance to capture all significant forward-looking financial commentary: market share, new products,pricing, inflation, margins, growth, Capex, hiring, share repurchase, etc.
We leveraged the Amenity NLP platform to identify 4 key trends beneath the score:
View of US consumer is mixed, but optimistic as Spring arrives
5G buildout on the horizon; Juniper caution is the outlier
Hourly earnings data is not a fluke, wage inflation is here to stay
Supply chain pressures continue to pinch the retail sector
Forecast Index Checks in at 45.0; Sharply Off Lows, but Down 5% YoY
1. US Consumer: Mixed, but skews positive
Have global growth fears migrated to the US consumer? Our data says no, or at least not yet, as spring spending appears to be on solid footing:
Lennar (3/27/19):
“We continue to believe, as we said last quarter, that the market took a natural pause, it has now adjusted and recalibrated, and we’re optimistic that demand, driven by fundamental economic strength, will continue to accelerate through the spring selling season.”
At Home Group (3/27/19):
“You have already heard from several retailers that prolonged winter weather caused a soft start to fiscal Q1. In the first part of the quarter, our entire footprint experienced colder average temperatures year-over-year. Markets that were less impacted by weather performed significantly better than their more weather-affected counterparts.As temperatures in those markets have stabilized, we are seeing demand rebound.”
KB Home (3/26/19):
“We saw market conditions beginning to improve in January with further improvement in February, and we are encouraged to see the solid trends continuing in March.”
Tiffany (3/22/19):
“We expect sales in the first half to be adversely affected by several factors: a meaningful FX headwind, lower foreign tourist spending and a difficult comparison to strong base period comps.”
Darden (3/21/19):
“The industry grew approximately 3% total growth, and that’s a really good number. I’m excited about that. I think,we’re going to continue to be able to grow share in that environment. So I think, the consumer is really strong at this point.”
Nike (3/21/19):
“There were some timing impacts related to our NBA business and the launch of certain products year-over-year. There are always timing impacts in terms of product launches. So yes, nothing in terms of a turn or change in consumer demand. In fact, consumer demand for our apparel in North America is very strong.”
2. 5G buildout is on the horizon; Juniper caution is the outlier
Like most new network technologies, 5G hype has run ahead of reality for sometime. I even remember 5G-driven bull cases from 2017. We are finally tracking an uptick in tone as carrier investment comes closer to reality, with Juniper standing out as a curious outlier:
Micron (3/20/19):
“We expect 5G adoption to create increased demand for memory and storage in IoT devices, wireless infrastructure and data centers. Our embedded and networking businesses are already starting to see benefit from early 5G infrastructure investments.”
Uniti Group (3/20/19):
“We continue to see strong wireless momentum as the rollout of 5G services continues to ramp.”
Juniper Networks, Deutsche Bank Conference (3/8/19):
“There is no obvious killer use case that would lead to 5G generating more business for the Service Providers. In fact, the ARPU compression in the SP space is real and it continues, right? So if we start from that macroeconomic perspective of the business of the SPs have and therefore what they can spend,we see a couple of things. There are places where SPs need to spend because 5G requires a pretty fundamental architecture change. We are cautious with some of the spend might be shifting from other areas of their CapEx and OpEx. And so all up yet to be seen whether that is a growth.”
Spirent Communications (3/7/19):
“We see a very solid demand backdrop that everything to do with building up mobile infrastructure or 5G wireless, that’s globally.”
Qorvo, Raymond James Conference (3/6/19):
“In fact, 5G is coming much faster than most of the industry believe.”
3. Hourly earnings data is not a fluke; wage inflation is here to stay
Growth in average hourly earnings accelerated in the most recent jobs report, even as overall job creation disappointed. Is the data reflective of reality? Our data suggests recent trends are sustainable:
Paychex(3/27/19):
“You are seeing wage growth probably in the 2.5%-2.7% range, which has been good. It’s coming up. And of course, those earning the least are getting the biggest increase. So they’re seeing — those earning minimum wage, etc, because of the minimum wage increases across the country are seeing 3.5%-4.0% increase, sometimes a little bit more, where salaried or the higher-wage earnings are seeing 2% or below 2% is what we’re seeing.”
Darden (3/21/19):
“We do anticipate our inflation to stay about where it is, and we’ll continue to find productivity enhancements to help offset.”
Cintas (3/21/19):
“Labor pressures, I would say, are about the same as we’ve seen in the first 2 quarters of this fiscal year. I wouldn’t call it any worse, but they still remain.”
AAR Corp (3/19/19):
“The labor market across the U.S. is extremely tight and our more labor-intensive activities have struggled to find enough qualified labor to meet the demand from customers. We’ve been impacted by these labor shortages in MRO during the last several quarters, and while we saw sequential improvement in MRO in Q3, it was not at the level that we had anticipated.”
Genesco (3/14/19):
“We still have upward pressure on wages. We think we can mitigate some of that with the workforce management program we are putting in place. But there is continued upward pressure on wages.”
Vail Resorts (3/8/19):
“As we go forward, I think that’s a topic (wage pressure) that’s going to be a challenge until there’s some shift in the employment market.”
4. Supply chain pressures continue to pinch the retail sector
Consumer spending and customer traffic have been a bit misleading over the last couple of quarters, as many retailers have been tripped up by the negative margin impact of e-commerce growth. This trend appears to be the new normal.
Ollie’s Bargain Outlet (3/26/19):
“The way we think of that internally is a merchandise margin improvement of about 25 to 30 basis points, and that will be offset by increased supply chain costs by about 25 to 30 basis points.”
RTW Retailwinds (3/21/19):
“Gross margin is expected to decrease 100-150 basis points, reflecting continued improvements in product margin, resulting from decreased product cost and reduced promotional activity, offset by increased shipping costs due to the growth of our eCommerce business.”
Herman Miller (3/20/19):
“The impact of the higher net freight cost, that has been one that has hurt us and we have to take a hard look at everything from pricing strategy there to — and that includes, by the way, the impact of HAY coming into the overall mix of that business.”
Williams-Sonoma (3/20/19):
“A lot of our supply chain initiatives to help lower some of our cost that hit gross margin should also be helpful. The tailwind — or the headwind, if you will, is the higher shipping costs that we continue to have, obviously, from both the UPS shipping rate increases but, more importantly, from the higher mix of furniture and the China tariffs, which is everybody’s question mark, as to where that’s going to land.”
FedEx (3/19/19):
“We anticipate that the large retailers are going to continue to fulfill locally. That’s going to put pressure on that top-line yield, but we have the right infrastructure to do so profitably, which is where FedEx Extra Hours and similar products come into play.”
See Amenity in April:
Our team at Amenity Analytics looks forward to joining Fintech leaders participating in the ESG5 Summit on Thursday, April 4th. Our CEO, Nate Storch, will speak and lead a panel discussion on text analytics and ESG integration.
Request access to Amenity Key Drivers, the NLP language modeling and scoring system. Analyze earnings call transcripts based on key fundamental factors that drive stock performance and uncover areas of risk, exposure, and opportunity hidden in financial documents.
This communication does not represent investment advice. Transcript text provided by S&P Global Market Intelligence.
Last week we introduced version 1.0 of the Amenity Forecast Index, which leverages Amenity Analytics’ NLP platform to track and analyze earnings sentiment of only forward-looking commentary from U.S. quarterly earnings calls. This analysis goes beyond the stated revenue and EPS guidance to capture all significant forward-looking financial commentary: market share, new products,pricing, inflation, margins, growth, Capex, hiring, share repurchase, etc.
Caution Emerges in Text and Data
We updated the Index for this week’s slate of corporate earnings and used our text analytics platform to identify the key themes driving the Index.
We highlight 5 key takeaways
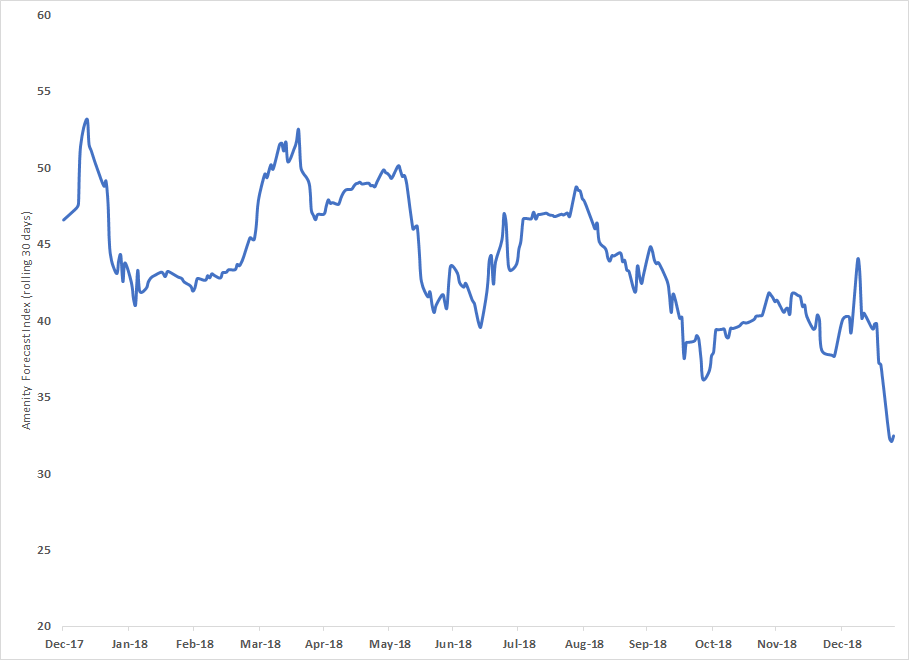
The Forecast Index declined to 32 from 40 a week ago and is now at a 12-month low
China challenges continue to remain front and center this week
The auto sector is showing deteriorating trends
Cost pressures and currency headwinds remain an overhang
All hope is not lost: pockets of strength in certain Industrial and Healthcare markets
1. The Amenity Forecast Index declined to 32 from 40 a week ago
The Amenity Forecast Index is measured on a scale of -100 to +100 on a rolling 30-day basis. As the chart below shows, the Index has firmly been in positive territory throughout 2018. However, the degree of bullishness in management sentiment waned as the year progressed, most significantly in June.
Have expectations been lowered enough that this earnings season can show an uptick? Or is “incrementally cautious”the new normal? Stay tuned for weekly updates to the Index throughout earnings season:
2. China challenges are front and center
TE Connectivity (1/23/19):
“Our revised 2019 guidance is driven entirely by weaker markets. This is primarily driven by China with some weakness in European auto as well.”
TE Connectivity (1/23/19):
“We expect communication segment to be down mid-single digits organically driven by Asia.”
Union Pacific (1/24/19):
“For 2019, our Ag Product groups expect uncertainty to continue in the grain market due to foreign tariffs.”
Las Vegas Sands (1/23/19):
“The VIP segment will continue to be challenging, I believe.”
Intel (1/24/19):
“Trade and macro concerns, especially in China, have intensified. Cloud service providers shifted from building capacity to absorbing capacity, and the NAND pricing environment has further deteriorated. Those incremental headwinds are impacting our revenue expectations and slightly reducing our operating margin percentage forecast.”
Western Digital (1/24/19):
“Geopolitical and macroeconomic conditions have contributed to our customers having a more cautious outlook.”
Avnet (1/24/19):
“The extent of the current slowdown in Asia is difficult to predict. During the quarter, we saw order weakness accelerate as time progressed, which makes calling the bottom somewhat challenging.”
3. Auto sector is pumping the brakes
Stanley Back & Decker (1/22/19):
“In the Industrial segment, we expect a relatively flat organic performance, reflecting softening conditions within the automotive end market.”
TE Connectivity (1/23/19):
“In our transportation segment, we are now assuming that global auto production will decline 4% to 5% in our fiscal year compared to our prior outlook of flat production in our fiscal year.”
Union Pacific (1/24/19):
“The U.S. light vehicle sales forecast for 2019 is 16.8 million units, down about 2% from 2018.”
4. Nothing new, but Cost Pressures and Currency Headwinds are still and overhang
Procter & Gamble (1/23/19):
“Commodity costs are expected to be a $400 million headwind and trucking cost will likely be up 25% or more versus last year’s levels.”
Kimberly-Clark (1/23/19):
“We expect commodities and currencies in total will be a headwind on operating profit of about 20%, including a high single-digit drag from currency rates. We expect to offset much of that with higher pricing.”
Procter & Gamble (1/23/19):
“We’re currently forecasting a foreign exchange headwind on earnings of about $900 million after tax.”
Waters (1/23/19):
“At today’s rates, currency translation is expected to decrease first quarter sales growth by 2 to 3 percentage points.”
IBM (1/22/19):
“We expect about a 1 to 2 point headwind on currency.”
5. All hope is not lost: pockets of strength in certain Industrial and Healthcare markets.
Union Pacific (1/24/19):
“In addition, we anticipate continued strength in Industrial Production, which drives growth in several commodities.”
United Rentals (1/24/19):
“So a lot of momentum going into 2019 and broad-based market activity to support a positive forecast.”
W.W. Grainger (1/24/19):
“U.S. revenue is expected to be driven by customer acquisition and increasing share of wallet. We continue to expect this business to grow 300 to 400 basis points faster than the market, with expected market growth of approximately 1%to 4%, which includes 1% of price.”
Abbott Laboratories (1/23/19):
“For 2019, we’re forecasting continued strong organic sales growth and double-digit EPS growth.”
Steel Dynamics (1/22/19):
“We continue to see strong order and strong customer optimism. We’re beginning 2019 with an even greater project backlog than this time last year, which is a positive indicator for nonresidential construction.”
Aspen Technology (1/23/19):
“There continues to be a positive outlook for technology spending overall, and we believe capital-intensive industries are in the midst of a secular technology adoption cycle.”
Norfolk Southern (1/24/19):
“We are excited about the momentum we are delivering and our operations, and we expect our performance to continue to improve in 2019 and beyond.”
Join the Amenity Viewer Beta Program today to analyze earnings call transcriptions and enable you to spot outliers, identify critical insights, and understand key drivers.
This communication does not represent investment advice. Transcript text provided by S&P Global Market Intelligence.
We updated the proprietary Amenity Forecast Index for recent corporate earnings using our text analytics platform to identify the key themes driving the Index.
About the Index: Earnings sentiment of only forward-looking commentary from U.S. quarterly earnings calls. This analysis goes beyond the stated revenue and EPS guidance to capture all significant forward-looking financial commentary: market share, new products,pricing, inflation, margins, growth, Capex, hiring, share repurchase, etc.
We highlight 3 key takeaways:
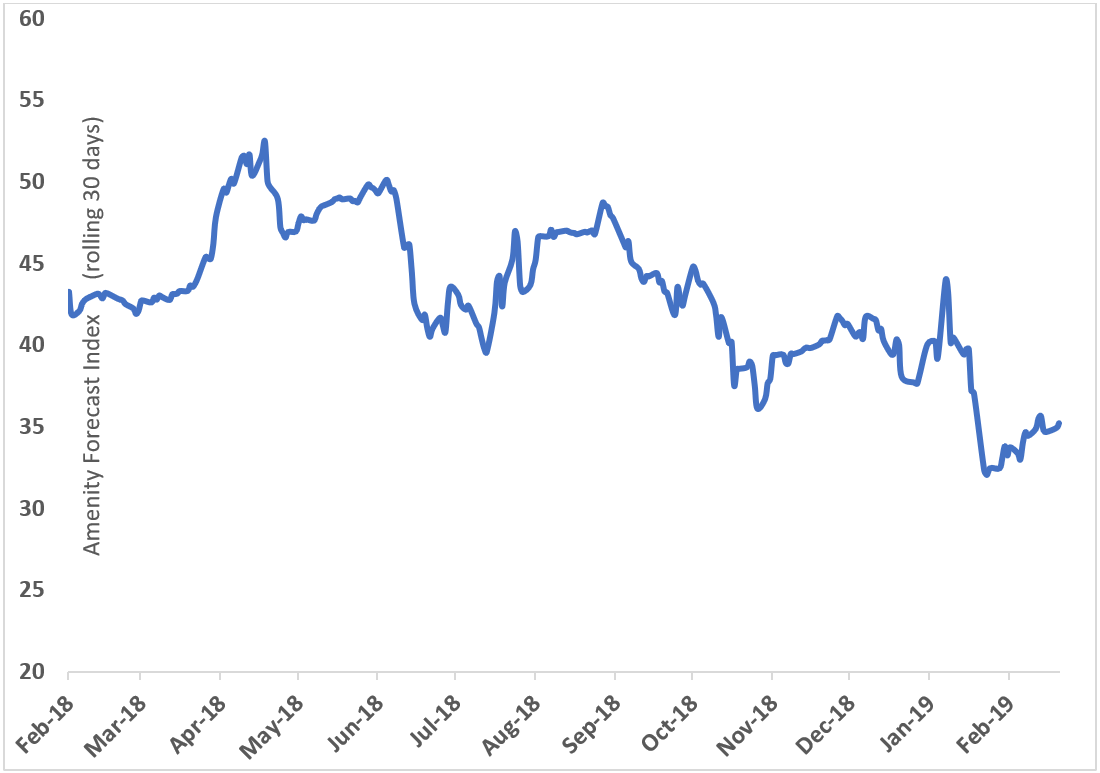
The Amenity Forecast Index has continued its slow upward grind from January lows, assisted by a dovish Fed, and China trade hopes. The index remains nearly 20% lower than the same point a year ago.
Europe has joined China at the forefront of global growth concerns.
Companies are expecting less margin pressure from raw material inflation than in 2018.
1. Amenity Forecast Index grinding slightly higher from the January lows
The latest Index reading of 35.2 compares to 33.7 at the beginning of the month, but remains well below 42.8 at this time last year. The Amenity Forecast Index is measured on a scale of -100 to +100 on a rolling 30-day basis.
The chart below shows the Index was firmly in positive territory throughout 2018 before catching a wave of caution through the first two weeks of Q4 earnings. Since the January low point, the Fed has turned more dovish and sentiment toward U.S. – China trade has turned more optimistic. Themes gaining prominence recently include weakness in Europe and less margin pressure from raw material inflation:
2. Europe joins China at the forefront of global growth concerns
The Eurozone PMI recently dipped into contractionary territory, but we doubt many multi-national CEOs were surprised by the number:
Nordson Corporation (2/21/19):
“I would say it kind of lines up with the economy in terms of just a slower growth year. I mean, you see it in Germany, you see it in France, it’s going to be a slower growth year. We’ll see if Brexit has any particular impact. We don’t expect it to have a big impact for us. But I think, in general,it’s affecting the economies.”
Genuine Parts Company (2/19/19):
“Our guidance reflects the cautiously optimistic outlook for 2019. We are being cautious due to the potential for an economic slowdown, and in particular, a slowing industrial economy in the second half of the year. In addition, we expect to see a more challenging sales environment in Europe in 2019.”
Ecolab (2/19/19):
“…the U.S. is forecasted to grow slower, but we’re not that GDP-sensitive. We still think it’s going to be a very solid economy. And our ability to go capture share and do things and offset lost business, et cetera, we think, remains pretty robust in the U.S. Europe is going to be a tougher environment,we think, probably where you see weaker economies maybe show up.”
Neenah, Inc. (2/12/19):
“I mentioned in early November that we were starting to sense more uncertainty in global demand. This ultimately contributed to lower shipments and inventory destocking by customers in the fourth quarter. Economies in Western Europe and Asia have slowed.”
BorgWarner (2/14/19):
“We expect that the challenging conditions in China and Europe will continue into 2019.”
3. Moderating raw material pressures fuel some optimism on margins
A number of inflationary pressures impacted margins in 2018 including freight, raw materials, and labor. On the raw materials front, companies are pointing to more balanced price-cost dynamics in 2019:
Valmont Industries (2/21/19):
“We expect a 20 to 50 basis point improvement in operating margins with average raw material cost, including grade,expected to be relatively flat in the aggregate to slightly deflationary in 2019 as compared with 2018.”
JELD-WEN holding (2/19/19):
“So what I would say is, we do expect price-cost tailwind for ’19. We’ve taken price actions here at the end of the year and into the early part of this year that would more than offset what we expect to see in inflation.”
Masonite International (2/19/19):
“We’re expecting about a 3% increase in commodity inflation in 2019. And we would expect some inflationary pressures to continue through the balance of that long-term growth framework horizon. Now we are seeing material cost begin to moderate a little bit as we get into ‘20 and ‘21.”
Cooper Tire & Rubber ( 2/19/19):
“Raw material costs appeared to have stabilized. Therefore, we expect our first quarter 2019 raw material index to be down nearly 3% sequentially, but up nearly 3%year-over-year.”
Tempur Sealy (2/14/19):
“After 2 years of material commodity cost headwinds, we do not currently expect commodity cost inflation in 2019.”
Dana Incorporated (2/15/19):
“…we expect commodity inflation to continue this year, albeit with a high recovery rate of about $90 million and a net profit headwind of about $40 million as commodity costs level out. This continues to put pressure on our profit margin expansion, but we are beginning to see signs that commodity costs will improve as we move through the year.”
Bloomin’ Brands (2/14/19):
“Commodities are expected to be up approximately 2% in 2019, as compared to approximately 3% in 2018.”
Join the Amenity Viewer Beta Program today to analyze earnings call transcriptions and enable you to spot outliers, identify critical insights, and understand key drivers.
This communication does not represent investment advice. Transcript text provided by S&P Global Market Intelligence.
We updated the proprietary Amenity Forecast Index for this week’s slate of corporate earnings, using our text analytics platform to identify the key themes driving the Index.
About the Index: Earnings sentiment of only forward-looking commentary from U.S. quarterly earnings calls. This analysis goes beyond the stated revenue and EPS guidance to capture all significant forward-looking financial commentary: market share, new products,pricing, inflation, margins, growth, Capex, hiring, share repurchase, etc.
We highlight 4 key takeaways
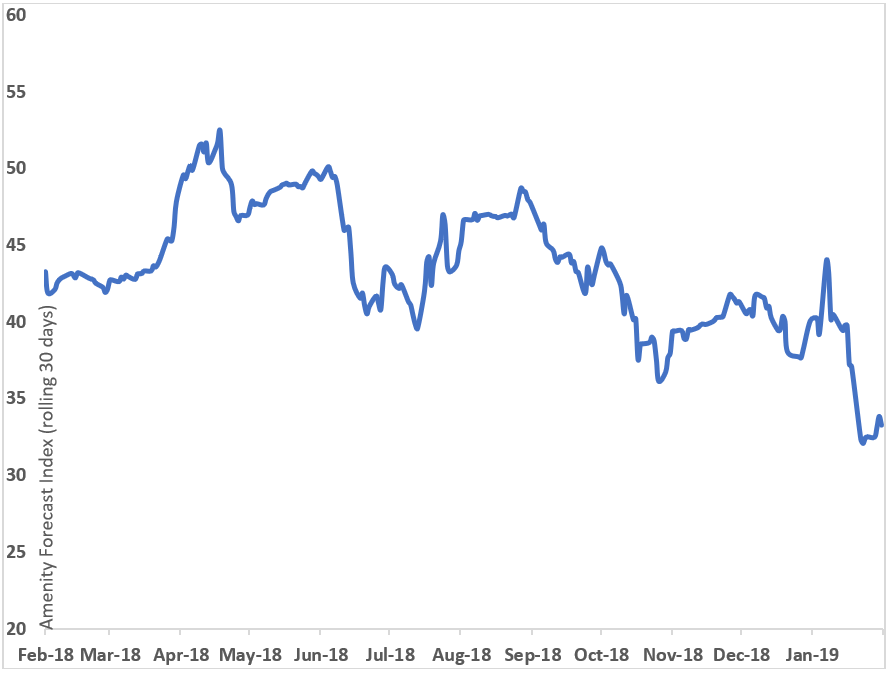
The Forecast Index improved marginally to 33.3 from 32.4 last week
The China slowdown continues, and safe to say, is now part of the status quo
Global macro commentary is mixed
We continue seeing pockets of strength in certain industrial markets
1. Amenity Forecast Index improved marginally off last week’s lows, to 33.3 from 32.4:
The Amenity Forecast Index is measured on a scale of -100 to +100 on a rolling 30-day basis. The chart below shows the Index was firmly in positive territory throughout 2018 before catching a wave of caution through the first two weeks of Q4 earnings. This week delivered a small relief, with the Index up slightly to 33.3 from last week’s 32.4. The key drivers of cautious forecasts remain the same, but factors such as macro uncertainty and slower growth in China are now becoming part of the status quo rather than incremental negatives:
2. The China slowdown is no longer surprising:
Caterpillar (1/28/19):
“We are forecasting the overall China market to be roughly flat in 2019, following 2 years of significant growth.”
Cypress Semiconductor (1/31/19):
“We continue to see our Asia-Pac distributors remaining cautious or in a wait-and-see approach to market uncertainties.”
Dow DuPont (1/31/19):
“We anticipate China to continue to grow this year, albeit at a slower pace.”
3M Company (1/29/19):
“I think in the case of China and Asia, where we’re guiding to low to mid-single digits, if anything, I’d expect the first quarter to be the more challenged of those and then progressively better.”
3. Overall macro commentary is mixed:
Mastercard (1/31/19):
“We anticipate continued strong growth in our business in 2019 but have assumed a slight moderation in the overall economic environment from 2018.”
United Parcel Service (1/31/19):
“Looking ahead to 2019, external forecasts are calling for somewhat softer export and GDP growth across major economies due to uncertainty over trade policy.”
Whirlpool (1/29/19):
“We anticipate continued economic and trade uncertainty to temper overall demand,resulting moderate, but positive industry growth of approximately 1% globally.”
4. Pockets of strength remain in Industrial markets:
Eaton (1/31/19):
“We expect 4% to 5% growth in Electrical Products with continued strength in Industrial and large commercial projects. For Electrical Systems & Services, we see 5% to 6% organic growth. And here, our backlog is very strong. We expect continued market strength in power distribution assemblies in the Americas and in the data center markets globally.”
Boeing (1/28/19):
“We continue to see healthy global demand for our offerings in commercial, defense, space, and services.”
Caterpillar (1/28/19):
“In Construction Industries, we believe a healthy U.S. economy, continued pipeline construction and state and local funding for infrastructure development will be favorable in 2019.”
Sherwin-Williams (1/23/19):
“I’d comment that we’re off to a very good start. January sales will come in high above our first quarter guidance, so we’re feelinggood about that momentum.”
General Electric (1/31/19):
“We expect industrial organic revenue growth to be up low to mid-single digits on the back of a significant ramp in renewables and continued strength in Aviation and Healthcare.”
Ball Corp (1/31/19):
“Given recent contract wins, we anticipate adding at least another 600 employees over the next 12 months.”
Join the Amenity Viewer Beta Program today to analyze earnings call transcriptions and enable you to spot outliers, identify critical insights, and understand key drivers.
This communication does not represent investment advice. Transcript text provided by S&P Global Market Intelligence.
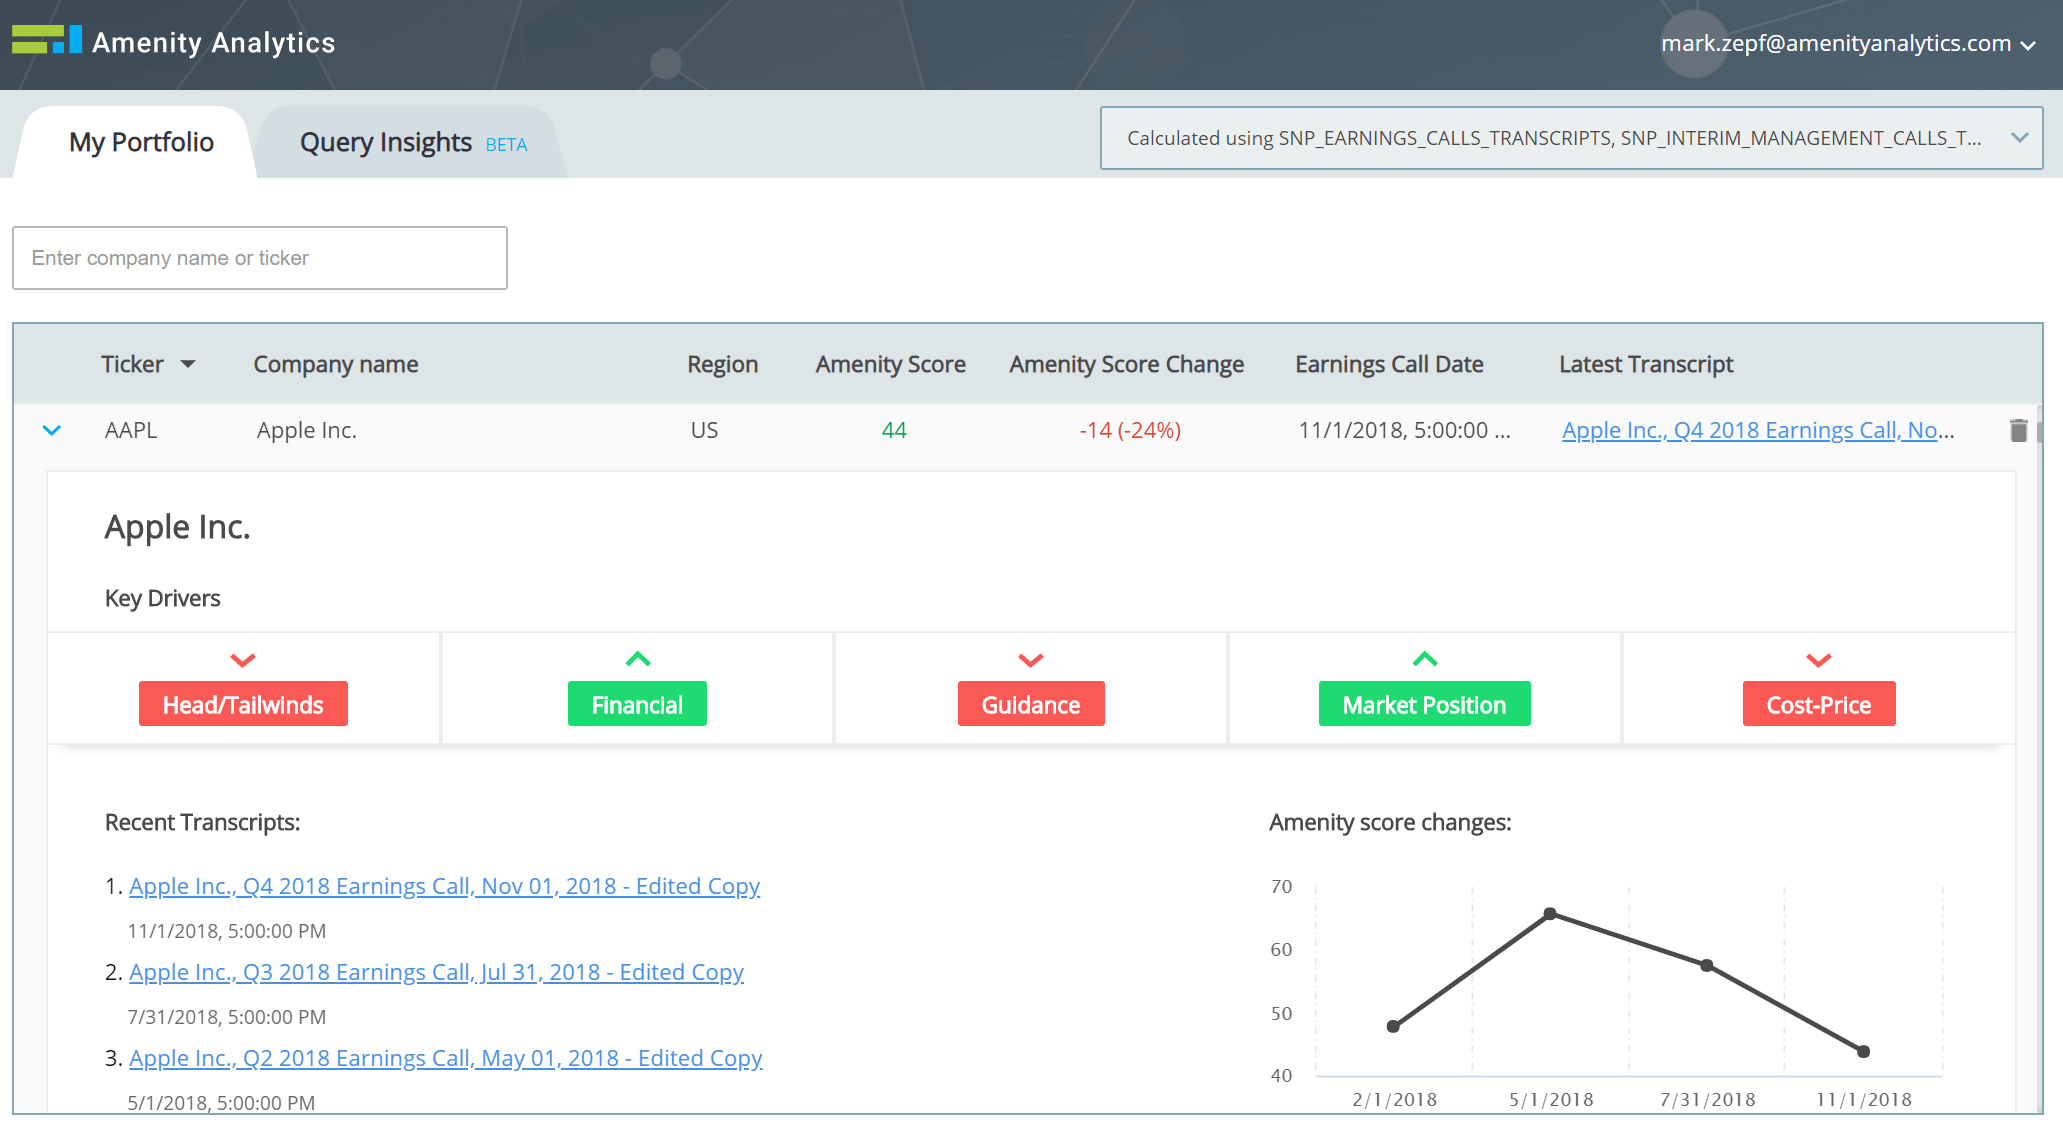
We used Amenity Viewer to analyze Apple’s FY4Q earnings call to identify 3 key insights and their underlying issues within a matter of minutes.
1. High Level View: Amenity Score Declined
The Amenity Score declined to 44 vs 58 the prior quarter, reaching its lowest level in 2018.
2. What Drove the Downtick?
The balance of macro Headwinds vs Tailwinds stood out among Key Drivers with a negative sequential change. When we look at the specific comments from the call, Emerging Markets and FX fluctuations are common themes.
“…we had an unprecedented number of products ramping, and while our ramps are going fairly well, we have uncertainty around supply and demand balance; and fourth, we also face some macroeconomic uncertainty, particularly in emerging markets.”
“The emerging markets that we’re seeing pressure in our markets like Turkey, India, Brazil, Russia, these are markets where currencies have weakened over the recent period. In some cases, that resulted in us raising prices, and those markets are not growing the way we would like to see.”
“The App store in China, we have seen a slowdown or a moratorium to be more accurate on new game approvals. There is a new regulatory setup in China, and things are not moving the way they were moving previously…I think this is strictly a domestic issue in China.”
“And when we look at the impact of foreign exchange on our revenue for the December quarter, we’re looking at 200 basis points of headwinds, which translate, given the size of our business, to almost $2 billion of headwind to our revenue.”
3. What About Apple Pulling Future Unit Disclosure?
Any time a company chooses to remove any disclosure to investors, it warrants attention. On Apples’ FY4Q call, there was not a significant increase in the total number of comments in the Amenity deceptive language category. However, two of the eight overall were in response to a question on Apple’s decision to withdraw future disclosure on units.
“But as I said earlier, a unit of sale is less relevant today than it was in the past.” (Identified by Viewer as a Detour)
“…as I said, we’ll provide the qualitative commentary when it is important and relevant, but at the end of the day, we make our decisions, from a financial standpoint, to try and optimize our revenue and our gross margin dollars.” (Identified by Viewer as a Euphemism)
Join the Amenity Beta Program today to analyze earnings call transcriptions and enable you to spot outliers, identify critical insights, and understand key drivers.
This communication does not represent investment advice. Transcript text provided by S&P Global Market Intelligence.
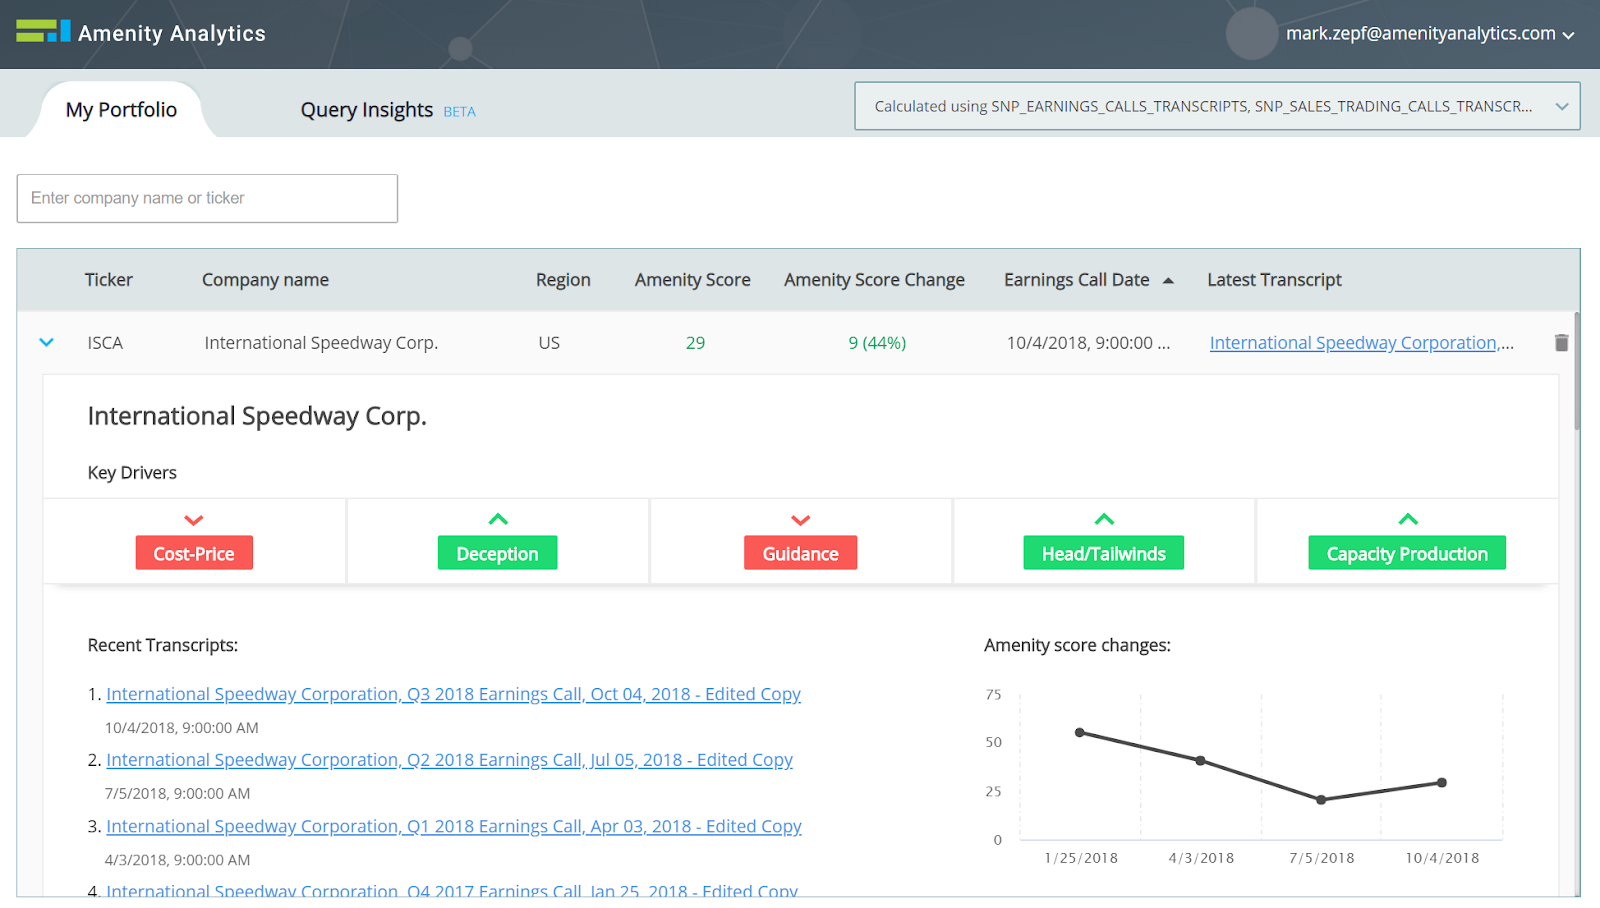
International Speedway Corp (ISCA) reported a disappointing quarter and outlook on 10/5/18, resulting in a 17% drop in the stock. Did the company kitchen sink the guide? Or is this just the first shoe to drop?
We used the Amenity Viewer to analyze ISCA’s recent earnings calls and look for insights related to those key questions.
Company View Takeaways
Amenity Score: Q3 registered an Amenity Score of 29, up from 20 the prior quarter
Key Drivers: For the Q3 call, the Guidance category was more negative, as was Pricing, while it is noteworthy that the Deception category was less negative
Amenity Score Trend: The 4-quarter time series shows that Q2 represented a steep drop by itself
The drop in Q2 leads us to first go back to that call to analyze what was so negative, and look for any clues to this upcoming miss.
Analysis of the Q2 Transcript (7/5/18) Revealed Some Caution Flags
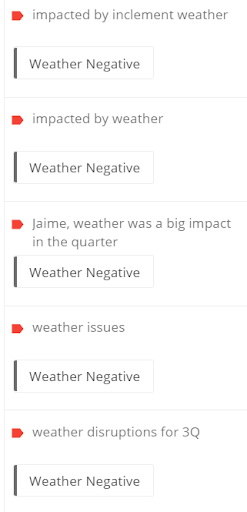
1. Was it all just weather?
When analyzing the Amenity Key Drivers are sorted by Negatives, we find a clustering of weather issues in the Headwinds category, captured in both Prepared remarks and Q&A. Much like holidays, weather can be a common scapegoat for other underlying issues:
“The approximate 10% decrease is primarily related to lower attendance and admissions for certain NASCAR and other events held during the quarter, some of which were impacted by inclement weather“
“Weather was a big impact in the quarter.”
2. Deception events increasing as Amenity Score decreases.
The Q2 call registered 8 events in our “Deception” category vs 6 in Q1. While not a massive change, analyzing these comments in the Viewer did reveal two comments that pointed to ongoing headwinds:
“So weather was an important part. But all in all, the attendance was a little softer than expected. We still have an issue with start power, and hopefully, this stable of young drivers coming along will start to win and build their brands, and – but I would also say that there is – I talked about our sales academy on the call, and we have retooled, elevated our sales culture.”
“Let’s face it though, when Sprint was in this sport, they were writing a check somewhere north of $75 million a year. And we, the industry, don’t know if that is viable going forward for long-term deals.”
3. A mixed Q2 followed by a reiterated guide…less cushion?
Despite a mixed quarter (including a drop in the Amenity Score to 20), the Viewer still showed a positive skew in forward-looking commentary (Guidance category). This was highlighted by reiterated FY guidance and optimism toward Q4, despite the challenges we see in the quotes above:
“We remain optimistic out consumer-focused marketing and sales initiatives are working to bring ticket sales in line to deliver stronger admission and admission-related results.”
“We’re not out of it yet, but we think these initiatives are going to bear fruit, and so we’re – we remain optimistic in these initiatives, and we’re going to stick to them.”
What then materialized in 3Q?
1. ISCA lowered the bar for Q4:
“Our 2018 guidance includes what we’ve incurred year-to-date through the third quarter and the outlook for the fourth quarter where we’ve experienced some headwinds and declines in admissions. We’ve worked prudently on the cost side of the business to manage margins. There is some compression in the margin guidance. But our fourth quarter’s going to be a little bit mixed.”
2. While weather still shouldered the blame, broader headwinds were acknowledged:
“Attendance for the comparable NASCAR events was down approximately 14% on average, and the average ticket price decreased to $83.88, or approximately 2.5%“
“Weather-related impacts were compounded by current headwinds in the ticket sales facing the sport.”
3. Events in “Deception” category dropped to just 3 vs 8 in Q2 and 6 in Q1
Putting all the pieces together:
Q2: Analysis in the Viewer highlighted increasing headwinds, a weakening Amenity Score, no cut to guidance, and comments that pointed to deeper issues than just the weather
Q3: The outlook was finally lowered, the Amenity Score stabilized, broader headwinds were acknowledged, and there were fewer comments flagged by Amenity’s Deception events
To the extent that less negative is sometimes the first positive, this analysis suggests ISCA may warrant a closer look.
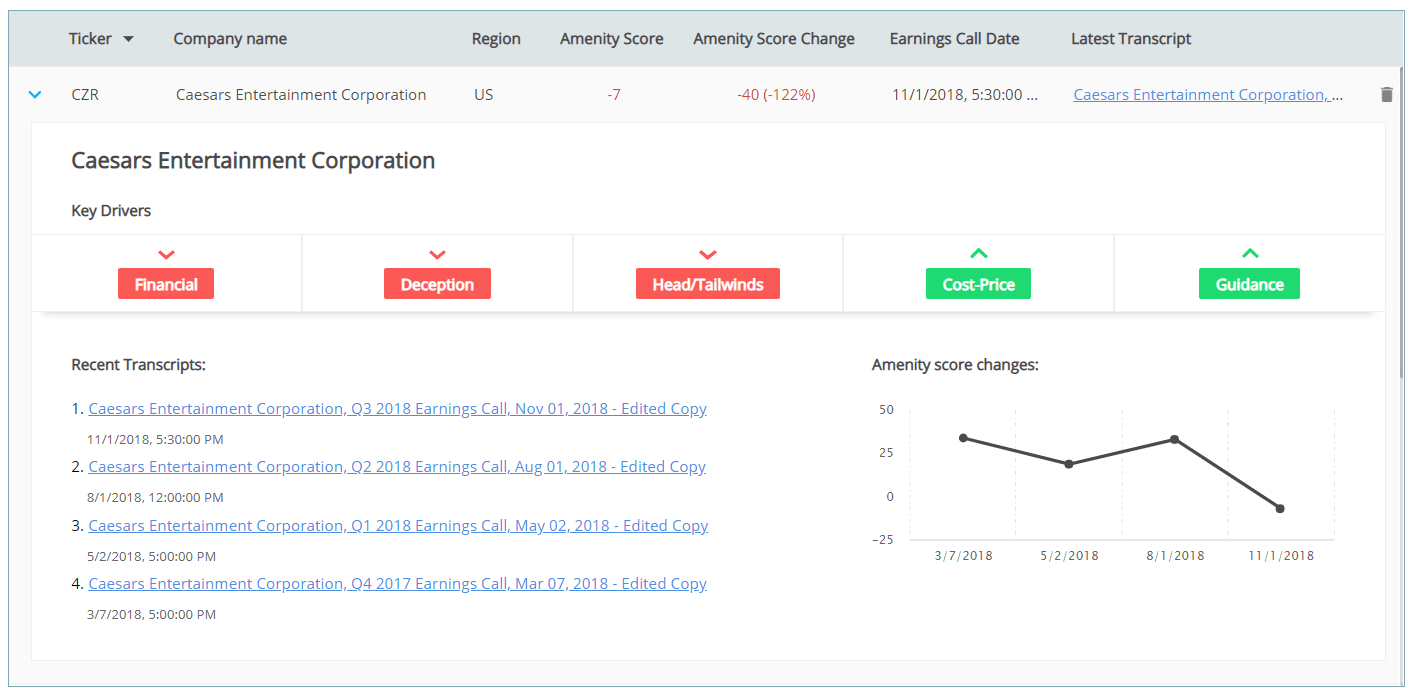
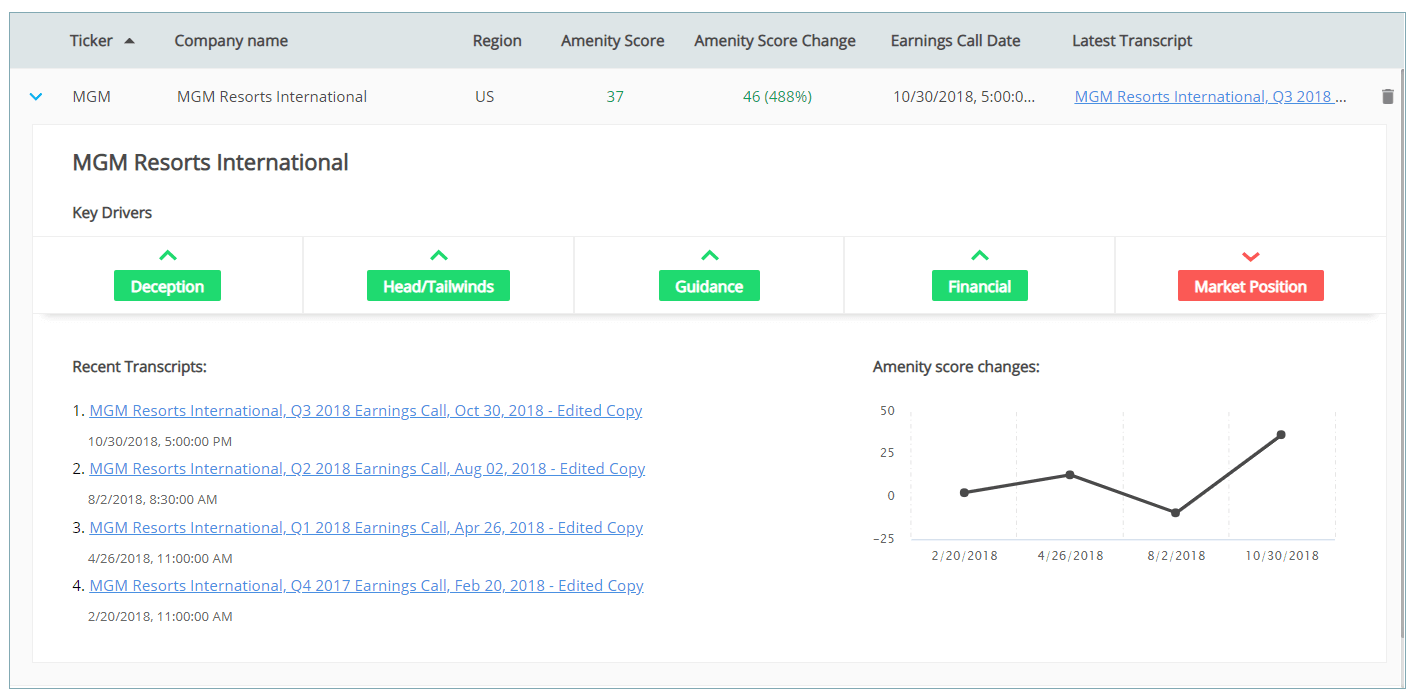
When analyzing Q3 earnings calls in Amenity Viewer, Caesars (CZR) and MGM Resorts (MGM) showed sharply disparate trends, with CZR registering an Amenity Score of negative 7, down from 33 last quarter while MGM registered an Amenity Score of 37, up from negative 9 the prior quarter.
At Amenity Analytics, we believe the Amenity Score is just the starting point of differentiated analysis, leveraging the Viewer to identify the why behind the trends in a matter of a few clicks. We explore the sentiment behind CZR and MGM to share 3 insights.
Company View: Caesar’s (CZR)
Company View MGM Resorts (MGM)
1. Las Vegas as a Market Was Soft in Q3, but MGM Outperformed its Plan While CZR Lagged Expectations
MGM
“While our Las Vegas Strip RevPAR was down year-over-year, it was ahead of our guidance, and we still achieved our second best third quarter RevPAR on record.”
CZR
“Demand in Las Vegas was softer than we anticipated based on our pace in the quarter and historical trends and dropped sharply in the back half of September.”
“…we anticipate our Las Vegas Strip RevPAR will be up 1 to 2% and overall revenues will be up slightly. We also expect our Las Vegas margins to be flat to up slightly as well.”
“…we expect MGM’s Group room nights to be up again, and we expect to gain market share, driven by the expansion of MGM Grand’s convention space and, of course, Park MGM.”
“We expect moderate revenue growth to our continuous improvement efforts and an ongoing disciplined approach to both top line and cost control that we believe will drive margin improvement.”
“…by ramping up our newly opened properties like MGM Cotai, MGM Springfield, Park MGM, we expect to accelerate cash flow and free cash flow.”
Guidance Trend Q2 vs Q3
“We still expect a strong fourth quarter.”
“I think that the only thing that for us was a surprise was the precipitous drop that we saw in September, but everything that we’ve seen since then has been pretty much a return to normalcy. So in terms of looking at the Vegas business model going forward, we remain bullish.”
“We’re also filling more rooms with casino customers early in the booking window, which will improve gaming revenues and hedge against any potential volatility in late booking and leisure demand.”
“We expect positive ADR growth in Las Vegas (in 2019).”
3. CZR’s Struggles in Atlantic City is Not Shared by MGM
MGM
“As I said, we really like our assets. It’s not lost on us that we have the most profitable assets in every regional market, in Mississippi, in Michigan, in New Jersey, and of course, the largest profit generator here in Nevada.”
CZR
“…we were impacted by increased competition in Atlantic City in the quarter.”
“Enterprise-wide adjusted EBITDAR of $600 million declined 2.1% driven by softness in Las Vegas as well as a drag from Atlantic City.”
“The impact in Atlantic City due to higher competition negatively impacted hold-adjusted EBITDAR by approximately $20 million versus 1 year ago.”
“…we will try our best to offset a lot of the revenue declines that we’re seeing and reduce expenses where we can, but the reality is that the 2 new operators entering the market in a period of low demand due to the time of year, it makes operating fixed cost businesses very challenging.”
Join the Amenity Viewer Beta Program today to analyze earnings call transcriptions and enable you to spot outliers, identify critical insights, and understand key drivers.
This communication does not represent investment advice. Transcript text provided by S&P Global Market Intelligence.
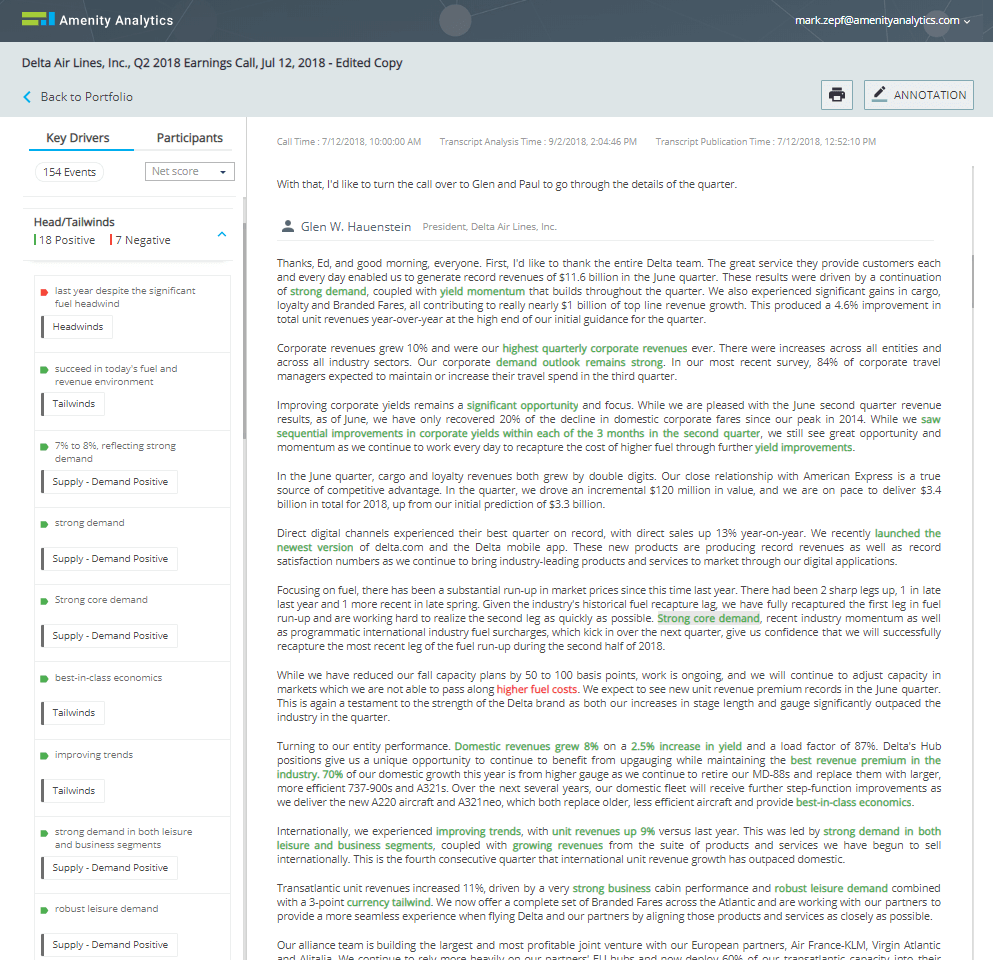
We used the Amenity Viewer to set the stage for Delta’s earnings call. Two key themes dominated the 2Q earnings calls for Delta and the industry as a whole:
Higher fuel costs weighing on margins and earnings
Broad-based demand strength
While fuel costs may have been a dominant theme across all airlines, their strategy and ability to offset those costs vary. This is likely tor remain a key focus for analysts and may be a driver of relative performance among the airlines in 3Q. Let’s explore this in more detail with Viewer.
Delta’s 2Q Earnings Call Compared Favorably vs Its Peers
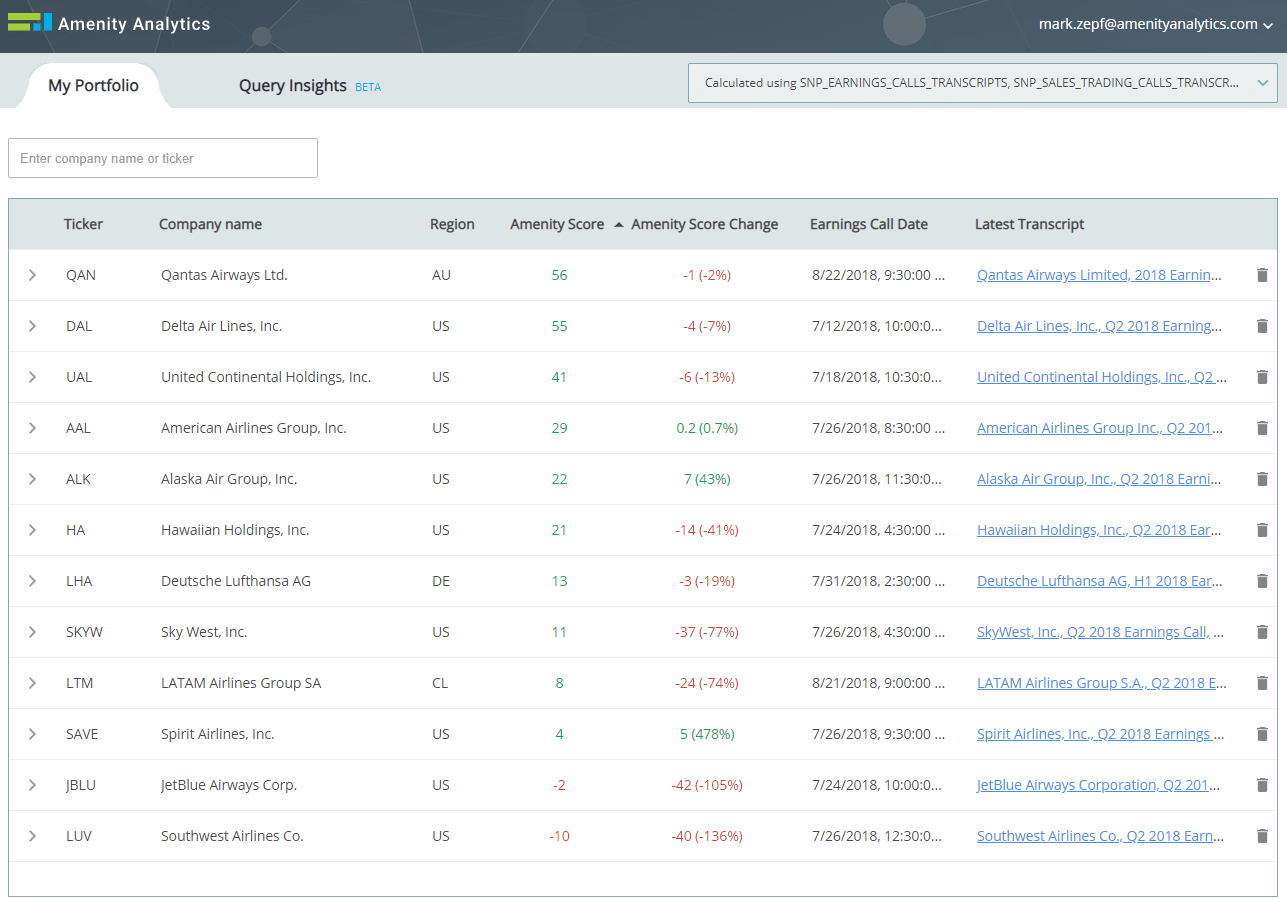
Delta scored near the top of airlines on an absolute basis with an Amenity Score of 55 (scale -100 to +100). Amenity Scores across the Airlines in 2Q were either flat or declining vs 1Q:
Some were stable vs the March quarter: QAN, DAL, UAL, LHA, AAL, ALK, SAVE
Others saw a sharp decline: HA, SKYW, LTM, JBLU, LUV
Airline Industry Performance
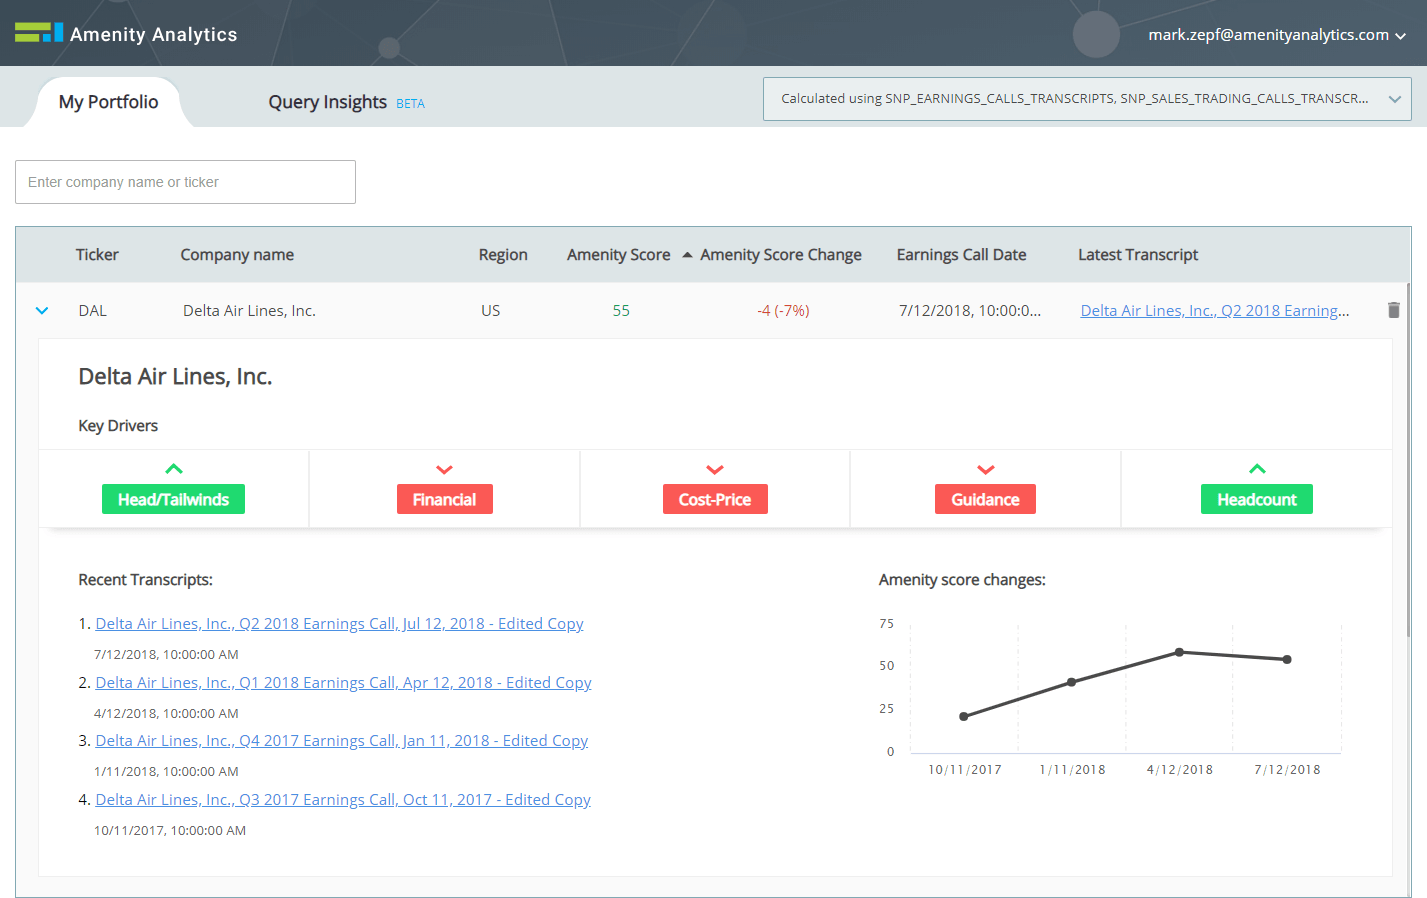
When we drill down into the Company View on Delta, the details yield the following:
Both 2Q and 1Q Amenity Scores were well above 2H2017 levels
There was a Downtick regarding input costs vs pricing
There was an Uptick related to tailwinds in the business
Company View
With the Company View serving as a backdrop we use Viewer to dive into the transcript itself.
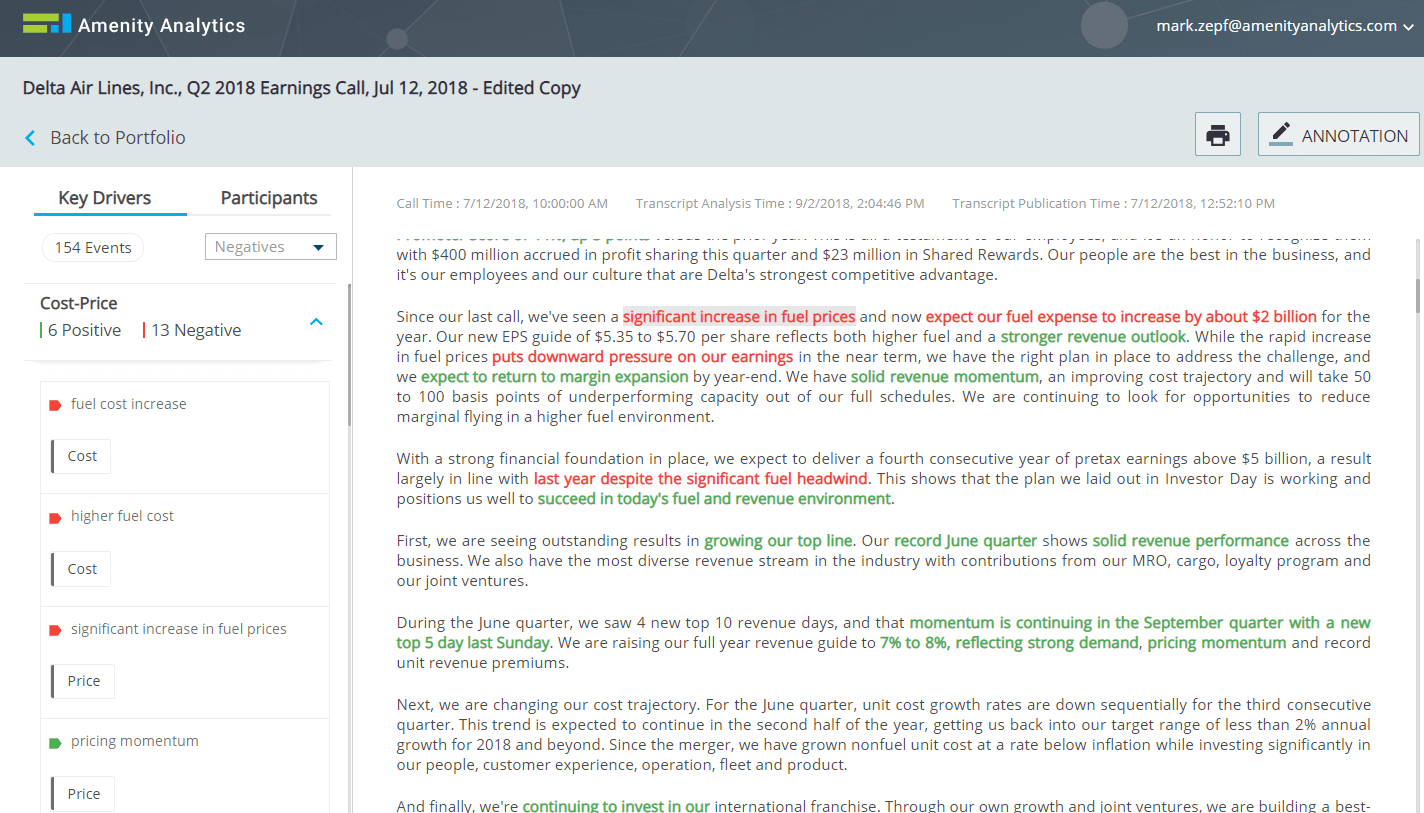
What is Driving the Unfavorable Cost-Price Mix, and What is Delta Doing to Offset?
Using the Key Drivers on the left to dive into Cost-Price, we quickly see a clustering of negative highlights related to higher fuel costs. When we see the highlights in the context of the document, it takes us to a paragraph that highlights some clear trends: higher fuel costs are weighing on earnings, despite a strong and improving revenue outlook.
Cost-Price Mix
What is Delta Doing to Deal With the Higher Fuel Cost? Both Pricing and Expense Control:
“We are raising our full year revenue guide to 7% to 8%, reflecting strong demand, pricing momentum and record unit revenue premiums.”
“Unit cost growth rates are down sequentially for the third consecutive quarter.”
“Pricing is certainly a function of cost. And with higher fuel prices, you’re going to expect to see ticket prices go up as well. Our pricing currently is up about 4% on a year-over-year basis, so I think it’s at a good level.”
How does that compare to the competition?
We analyzed these same Cost-Price dynamics in the other Airlines earnings calls. Pricing was mentioned sparingly, with more airlines leaning on operating cost reductions. Note that the two companies most vocal on price (Delta and United Continental) scored near the top of the group overall. Perhaps the strong flexing their muscles? Separately, Southwest lives up to its reputation for more aggressive fuel hedging programs.
United Continental (7/18)
“Higher fuel prices that we expect will be more than offset by improved revenue and continued cost discipline“
“Strong performance from our revenue management team and Gemini, our new yield revenue management system, combined with an improving pricing environment, allowed us to drive higher domestic PRASM even in tough industry conditions.”
American (7/26)
“We’re taking aggressive actions in the immediate term, including lowering our 2018 capacity growth, reducing our non fuel expenses and deferring future aircraft deliveries and CapEx.”
Southwest (7/26)
“With hedging losses well behind us, and a strong hedge in place for this year as well as next, we are well positioned to manage through fuel price headwinds.”
JetBlue (7/24)
“The right thing for us to do is make these adjustments, including the capacity cuts in the fourth quarter.”
Alaska Air (7/26)
“It’s clear that we have higher cost and we need to be focused on taking actions that help us recover these higher costs.”
Spirit (7/26)
“Better operational performance was a large driver of this improvement and resulted in lower passenger re-accommodation expense and lower crew disruption expense per ASM as well as improved labor productivity and efficiency, which helped to partially offset the impact of higher wage rates.”
Hawaiian (7/24)
“We’re seeing sequential improvement in non fuel unit costs as expected.”
What drove the Tailwinds uptick among the Amenity Key Drivers?
In the Key Driver drop-down on the left, we see another cluster; bullish demand commentary, both leisure and business:
Bullish Cluster
Join the Amenity Viewer Beta Program today to analyze earnings call transcriptions and enable you to spot outliers, identify critical insights, and understand key drivers.
This communication does not represent investment advice. Transcript text provided by S&P Global Market Intelligence.
We highlight The J. M. Smucker Company (SJM) in our Deception Spotlight following the company’s 2Q20 earnings call on 22 November 2019. Despite beating EPS estimates, the underlying story remains unsettling. The beat drove shares up 5% on Friday, though a look through fresh eyes after the weekend saw shares trade down 4% on Monday.
Focusing more on the longer-term, our analysis finds questions about revenue have triggered deceptive answers by management in earnings calls at an increasing rate, which may further erode confidence given the ongoing calls for top-line improvements. This sort of evidence may provide fodder for bear theses and be a honeypot for activists. We narrate the context for our concern and detail deceptive language detected by Amenity’s NLP models below.
The Pre-Earnings Saga
SJM is a leading manufacturer of packaged consumer and pet foods in the United States, though the company has been plagued by fundamental challenges for years. Incumbency advantages in end markets have lost ground as the product lineup fails to keep pace with changing consumer preferences. Attempts to innovate have fallen short and new entrants have taken share, particularly in pet food. And having missed guidance in six of the last seven years, the company faces something of an existential crisis in dealing with an anachronistic brand portfolio that seems to offer all the wrong products in all the right categories.
The week before the call, that crisis came to a head with a sweeping executive changeup aimed at righting the ship. New leadership is now inbound for the roles of CFO, COO (newly created role), the heads of Pet Food & Snacks and US Retail Sales & Away-From-Home, and more. (For Pet Food driven investors, the company is also bringing on an experienced consultant to assist with the turnaround…) While these efforts might be appreciated, they hint at the severity of the underlying business challenges while amplifying expectations of headwinds through the transition. In any event, we appreciated one analyst noting the absence of changes to the executive compensation structure, which is pegged to EPS growth rather than revenue growth. Once again, the wrong product in the right category.
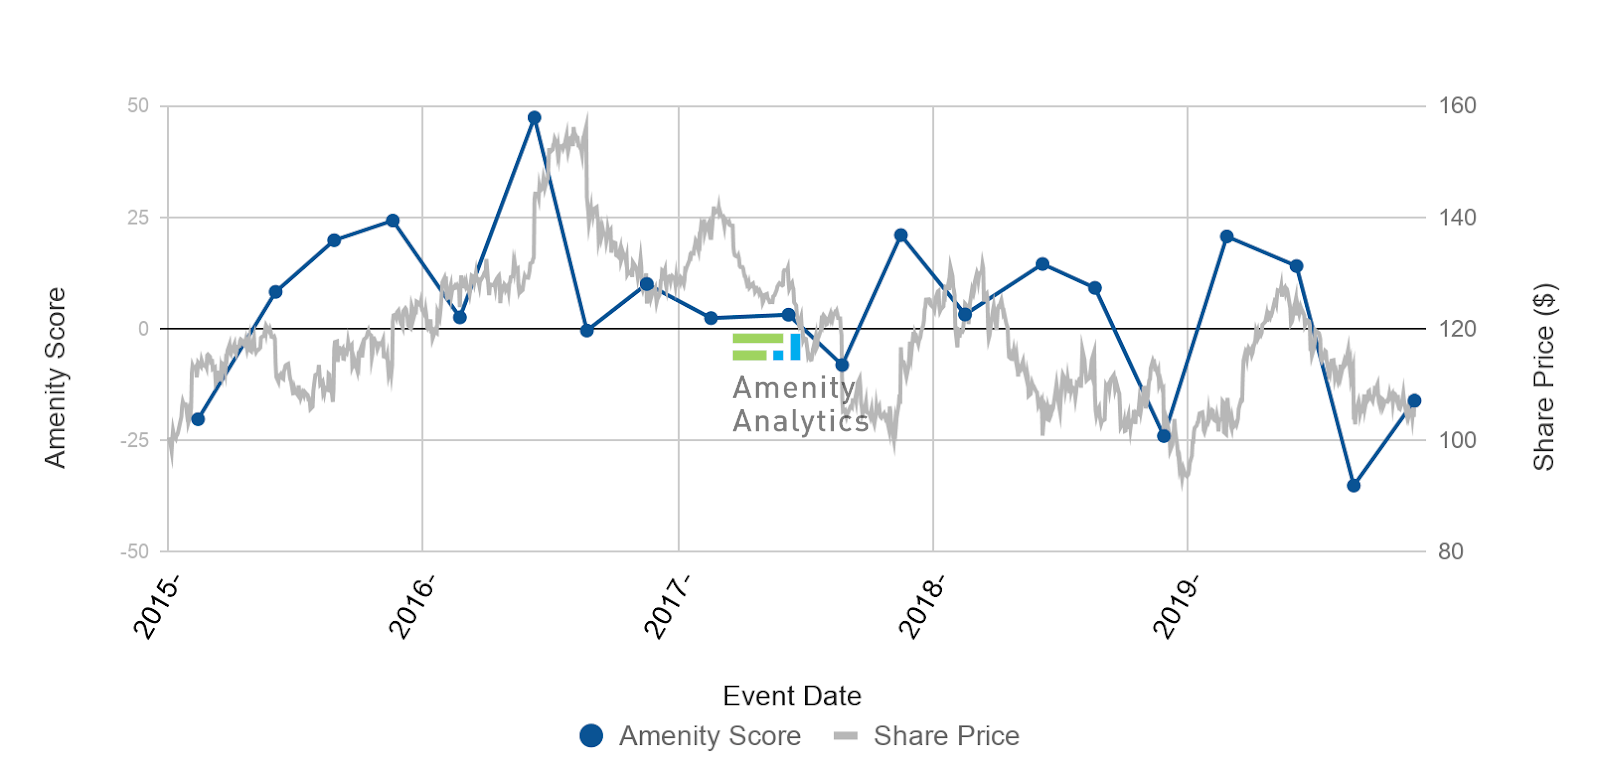
The J.M. Smucker Company (SJM) — Amenity Score vs Share Price
Looking to the fundamentals expressed on earnings calls as represented by our Amenity Scores (see Figure above), we observe that SJM’s management has offered investors a roller coaster ride in both the sentiment expressed in quarterly earnings calls and the resulting share price movements in a procession of fits and starts.
The Post-Earnings Saga
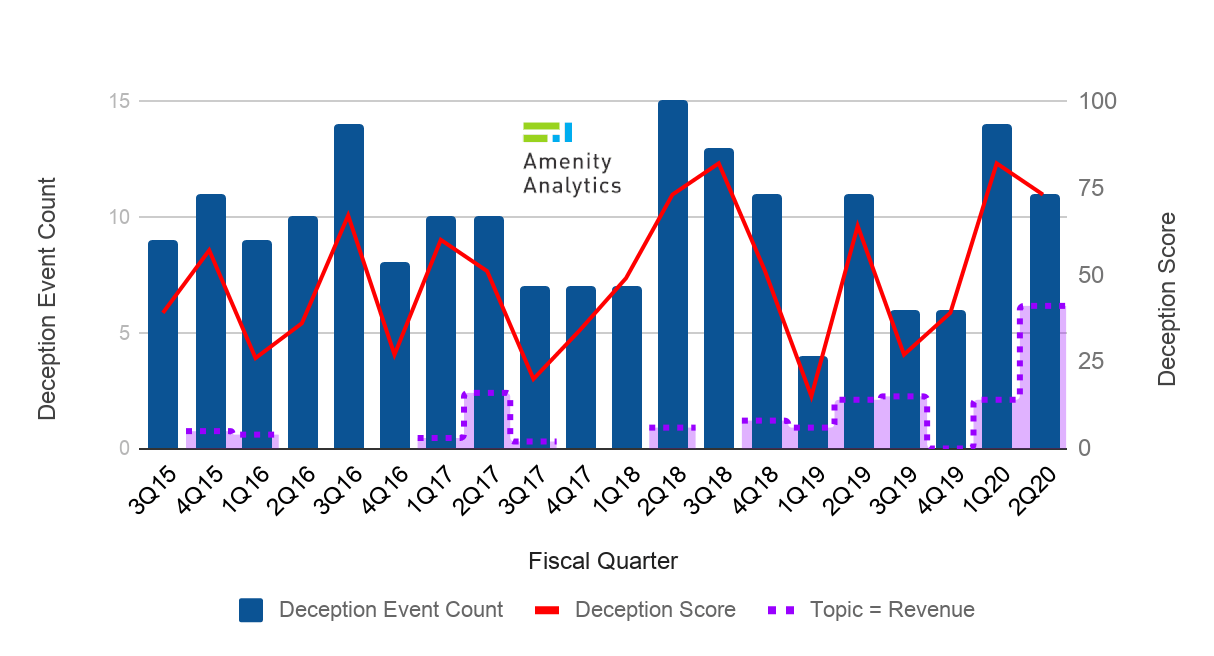
Underlying the musical chairs of the ongoing organizational shakeup is concern about the ability of management to grow top-line revenue. While management seems to be taking the right actions with initiatives focused on product innovation and brand support, we find concerning evidence in our Deception Model that suggests questions about revenues are increasingly triggering deceptive answers from management. SJM presents an outlier case where the overall deception has improved while deception related to a core concern like revenue has increased three fold.
We visualize this data in the figure below, which portrays SJM’s deceptive event count (in blue), Deception Score (in red), and the portion of SJM’s Deception Score attributable to questions on the topic of revenues (in purple). We observe a marked uptick over the past five quarters in deceptive answers to revenue related questions, which may serve as further evidence that erodes confidence in management’s ability to deliver (on) their message.
The J.M. Smucker Company (SJM) — Deception Over Time
Coupled with the fact that (1) the 2Q20 earnings beat came from lower costs due to financial discipline and lighter marketing spend and (2) management guided down FY20 performance, the spike in deceptive answers to questions about revenue may be a tip off for broader underlying issues. To the extent that the ongoing turnaround efforts will require steep transition costs, potential price cuts, and new marketing spend, we see good reason for concern.
For context, we provide illustrative deceptive commentary from the call for your reference below. As always, please feel free to reach out with any questions or concerns.
Illustrative Deceptive Commentary
Mark Smucker — CEO, President & Director, SJM:
“We’ve begun a search for those roles, and those are underway. It’s hard to say when we will actually fill them. Those things can take time. We are moving as fast as we can, but we want to make sure that we find the right individual that has both the right level of operating experience, but also the appropriate level of leadership experience in terms of developing people and culture. So I won’t commit to a time frame, but suffice it to say, we’re on it, and we’re moving as quickly as we can.”
“And then ultimately, at the end of the day, I just go back to my prepared comments, that the intent of the structure outside of any individual change is really intended again to increase agility, make sure that we have the right level of accountability and the right sets of eyes on the business that are going to really drive strategy.”
“I can’t give you much more color, so I’m not sure you’ll be that pleased with the answer, but I do — what I would say is we previously talked about a restage.”
“So if you look across some of the FDA comments that came out, I don’t know, a couple of months ago, there has been a modest impact to all brands that were named in that, and that does not include — that includes our brands but it also includes all of the competitive brands as well. It is difficult, very difficult to quantify what that is.”
Mark Belgya — Vice Chair & CFO, SJM:
“So in terms of just forecasting generally, I think that with some of the derisking, if you will, of our guidance for the rest of the fiscal, we feel that we have taken a prudent approach to consider the competitive activity, particularly in premium pet, have thought through where we had some strong finishes last year there might be a bit more of a challenge to get through, and do feel that we have appropriately recognized that we would expect earnings growth, albeit not as fast as we originally expected at the beginning of the year, but we would expect that to be in Q4, as I commented on Q3 being down slightly. And I don’t think there’s anything dramatically different in our ability to do so.”
Interested running these types of analyses with our platform?
Request a demo today to find out how you can analyze earnings call transcripts and other financial documents with our text analytics platform. Spot outliers, identify critical insights, and understand key drivers.
About Amenity
Amenity Analytics is the industry leader in providing insights from unstructured text by using Natural Language Processing (NLP) assisted by Artificial Intelligence (AI) and Machine Learning (ML). Amenity’s NLP system is a sector-agnostic, language-dependent tool for quantitative text analysis that is deployed across the financial services industry and beyond.
This communication does not represent investment advice. Transcript text provided by FACTSET and S&P Global Market Intelligence.